3. Data and Methods
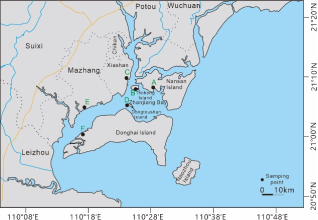
The research team established sampling sites in the mangrove wetlands of Zhanjiang Bay by combining satellite remote-sensing images with field investigations. Factors such as mangrove community composition, tidal level changes, and human activities were comprehensively considered. The selected sampling stations included Nansan Island (A), the southern part of Techeng Island (B), the Guanhai Promenade (C), Dongtoushan Island (D), Huguang Town (E), and the western part of Donghai Island (F). Among them, the sampling site on Nansan Island was located on the bare tidal flat within the bay, far from the mangrove forests. The sampling site on Techeng Island was in the intertidal zone, where mangrove pneumatophores were visible. The sampling site at the Guanhai Promenade was also on an intertidal bare flat, with low mangrove development and sparse vegetation. The sampling site on Dongtoushan Island was close to the mangrove community, and sand extraction activities could be seen nearby. The sampling site in Huguang Town was located near a national mangrove nature reserve, with dense mangrove pneumatophores surrounding the site, along with human activities. Similarly, the sampling site on Donghai Island was also surrounded by dense mangrove pneumatophores and human activities. At each station, 100 cm-long cylindrical sediment samples were collected, stored, and transported in PVC tubes.
The PVC core tubes were brought back to the laboratory, where they were meticulously recorded before being cut into sections at 5 cm intervals for grain size analysis. The pre-treatment process of the samples involved taking an appropriate amount of dried samples at low temperatures (<40°C) and placing them in a beaker. A suitable amount of diluted HCl and an excess of H
2O
2 (30%) were added, and the mixture was heated to boiling for 20 minutes to remove carbonates and organic matter
| [1] | Luo, S. Y., Quan, X. W., Chen, B. S., et al. Grain Size Characteristics and Sedimentary Dynamics of Sedimentary Colu-mn of Mangrove Wetland in Zhanjiang Bay, Geoscience. 2021, 35(03): 647-656. https://doi.org/10.19657/j.geoscience.1000-8527.2020.101 |
| [2] | Chen, B. S., Chen, S. M., He, Z. P. Grain Size Distribution Features of Surface Sediments from Mangrove Wetland of Leizhou Peninsula, Geoscience. 2019, 33(01): 198-205. https://doi.org/10.19657/j.geoscience.1000-8527.2019.01.19 |
| [3] | Li, T., Li, T. J., Chen, L., et al. The grain-size characteristics and their environmental indications of the island intertidal surface sediments of Zhanjiang offshore area, Marine Sciences. 2012, 36(04): 113-120. |
| [4] | Zhang, J. B., Yao, J. H., Chen, C. L., et al. Grain size distribution of surface sediments and its correlation with environmental factors in intertidal flat of Donghai Island, Zhanjiang, Journal of Applied Oceanography. 2015, 34(01): 49-56. |
[1-4]
. Subsequently, 10 ml of 0.05 mol/L (NaPO
3)
6 dispersing agent was added, and the mixture was boiled. After standing for 24 hours, the supernatant was decanted and diluted, followed by ultrasonic oscillation for 10 minutes
| [1] | Luo, S. Y., Quan, X. W., Chen, B. S., et al. Grain Size Characteristics and Sedimentary Dynamics of Sedimentary Colu-mn of Mangrove Wetland in Zhanjiang Bay, Geoscience. 2021, 35(03): 647-656. https://doi.org/10.19657/j.geoscience.1000-8527.2020.101 |
| [2] | Chen, B. S., Chen, S. M., He, Z. P. Grain Size Distribution Features of Surface Sediments from Mangrove Wetland of Leizhou Peninsula, Geoscience. 2019, 33(01): 198-205. https://doi.org/10.19657/j.geoscience.1000-8527.2019.01.19 |
[1, 2]
. The Malvern Panalytical Mastersizer 3000 laser granulometer (measurement range: 0.3 nm to 3 mm, repeatability: 0.5%) was used to analyze each sample, with five repeated measurements per sample and the average value taken. The international classification standards for grain size were adopted: sand (-1φ to 4φ), silt (4φ to 8φ), and clay (>8φ). The grain size parameters were calculated using the graphical method proposed by Folk and Ward
| [5] | Jenny, J. J., Yan, H. Y., Wang, X. F., Su, H. Sediment mercury concentration of a subtropical mangrove wetland responded to Hong Kong-Shenzhen industrial development since the 1960s, Marine Pollution Bulletin. 2023, 192, 115047. https://doi.org/10.1016/j.marpolbul.2023.115047 |
[5]
, including median diameter (
Md), mean grain size (
Mz), sorting coefficient (
δ), skewness (
Sk), and kurtosis (
Kg).
Mean grain size (
Mz): For an actual particle population composed of particles of different sizes and shapes, the diameter of a hypothetical population of uniform spherical particles that has the same total particle size as the actual population is defined as the mean grain size
| [1] | Luo, S. Y., Quan, X. W., Chen, B. S., et al. Grain Size Characteristics and Sedimentary Dynamics of Sedimentary Colu-mn of Mangrove Wetland in Zhanjiang Bay, Geoscience. 2021, 35(03): 647-656. https://doi.org/10.19657/j.geoscience.1000-8527.2020.101 |
| [2] | Chen, B. S., Chen, S. M., He, Z. P. Grain Size Distribution Features of Surface Sediments from Mangrove Wetland of Leizhou Peninsula, Geoscience. 2019, 33(01): 198-205. https://doi.org/10.19657/j.geoscience.1000-8527.2019.01.19 |
| [8] | Folk, R. L., Ward, W. C. Brazos River bar: a study in the significance of grain size parameters, Journal of Sedimentary Research. 1957, 27(1): 3-26. |
[1, 2, 8]
. Median diameter (
Md): The particle diameter corresponding to 50% cumulative grain size distribution of the sample
| [1] | Luo, S. Y., Quan, X. W., Chen, B. S., et al. Grain Size Characteristics and Sedimentary Dynamics of Sedimentary Colu-mn of Mangrove Wetland in Zhanjiang Bay, Geoscience. 2021, 35(03): 647-656. https://doi.org/10.19657/j.geoscience.1000-8527.2020.101 |
| [2] | Chen, B. S., Chen, S. M., He, Z. P. Grain Size Distribution Features of Surface Sediments from Mangrove Wetland of Leizhou Peninsula, Geoscience. 2019, 33(01): 198-205. https://doi.org/10.19657/j.geoscience.1000-8527.2019.01.19 |
| [8] | Folk, R. L., Ward, W. C. Brazos River bar: a study in the significance of grain size parameters, Journal of Sedimentary Research. 1957, 27(1): 3-26. |
[1, 2, 8]
. Sorting coefficient (
δ): The ratio of the particle diameters at 75% and 25% on the cumulative grain size curve, indicating the sorting of clastic sediments.
δ = P75/P25. When particles are well-sorted, P25 and P75 are close, so the closer the value is to 1, the better the sorting. Conversely, the value is much greater than 1
| [1] | Luo, S. Y., Quan, X. W., Chen, B. S., et al. Grain Size Characteristics and Sedimentary Dynamics of Sedimentary Colu-mn of Mangrove Wetland in Zhanjiang Bay, Geoscience. 2021, 35(03): 647-656. https://doi.org/10.19657/j.geoscience.1000-8527.2020.101 |
| [2] | Chen, B. S., Chen, S. M., He, Z. P. Grain Size Distribution Features of Surface Sediments from Mangrove Wetland of Leizhou Peninsula, Geoscience. 2019, 33(01): 198-205. https://doi.org/10.19657/j.geoscience.1000-8527.2019.01.19 |
| [8] | Folk, R. L., Ward, W. C. Brazos River bar: a study in the significance of grain size parameters, Journal of Sedimentary Research. 1957, 27(1): 3-26. |
[1, 2, 8]
. Skewness (
Sk): A statistical parameter indicating the degree of asymmetry in the random series distribution. It reflects the mean and dispersion of the frequency density distribution curve but does not reflect its symmetry
| [1] | Luo, S. Y., Quan, X. W., Chen, B. S., et al. Grain Size Characteristics and Sedimentary Dynamics of Sedimentary Colu-mn of Mangrove Wetland in Zhanjiang Bay, Geoscience. 2021, 35(03): 647-656. https://doi.org/10.19657/j.geoscience.1000-8527.2020.101 |
| [2] | Chen, B. S., Chen, S. M., He, Z. P. Grain Size Distribution Features of Surface Sediments from Mangrove Wetland of Leizhou Peninsula, Geoscience. 2019, 33(01): 198-205. https://doi.org/10.19657/j.geoscience.1000-8527.2019.01.19 |
| [8] | Folk, R. L., Ward, W. C. Brazos River bar: a study in the significance of grain size parameters, Journal of Sedimentary Research. 1957, 27(1): 3-26. |
[1, 2, 8]
. The greater the absolute value of
Sk, the more severe the skewness.
Sk < 0 indicates a left-skewed distribution (negative skew), where the mean is to the left of the mode.
Sk > 0 indicates a right-skewed distribution (positive skew), where the mean is to the right of the mode
| [1] | Luo, S. Y., Quan, X. W., Chen, B. S., et al. Grain Size Characteristics and Sedimentary Dynamics of Sedimentary Colu-mn of Mangrove Wetland in Zhanjiang Bay, Geoscience. 2021, 35(03): 647-656. https://doi.org/10.19657/j.geoscience.1000-8527.2020.101 |
| [2] | Chen, B. S., Chen, S. M., He, Z. P. Grain Size Distribution Features of Surface Sediments from Mangrove Wetland of Leizhou Peninsula, Geoscience. 2019, 33(01): 198-205. https://doi.org/10.19657/j.geoscience.1000-8527.2019.01.19 |
| [8] | Folk, R. L., Ward, W. C. Brazos River bar: a study in the significance of grain size parameters, Journal of Sedimentary Research. 1957, 27(1): 3-26. |
[1, 2, 8]
. Kurtosis (
Kg): A numerical characteristic reflecting the sharpness of the “peak” near the mode of the density function curve of X. The kurtosis of a normal distribution is 0. For other distributions, kurtosis describes the steepness or flatness of the distribution density shape compared to a normal distribution. Distributions with higher peaks and narrower tails than a normal curve are called leptokurtic (positive kurtosis), while those with lower peaks and wider tails are called platykurtic (negative kurtosis)
| [1] | Luo, S. Y., Quan, X. W., Chen, B. S., et al. Grain Size Characteristics and Sedimentary Dynamics of Sedimentary Colu-mn of Mangrove Wetland in Zhanjiang Bay, Geoscience. 2021, 35(03): 647-656. https://doi.org/10.19657/j.geoscience.1000-8527.2020.101 |
| [2] | Chen, B. S., Chen, S. M., He, Z. P. Grain Size Distribution Features of Surface Sediments from Mangrove Wetland of Leizhou Peninsula, Geoscience. 2019, 33(01): 198-205. https://doi.org/10.19657/j.geoscience.1000-8527.2019.01.19 |
| [8] | Folk, R. L., Ward, W. C. Brazos River bar: a study in the significance of grain size parameters, Journal of Sedimentary Research. 1957, 27(1): 3-26. |
[1, 2, 8]
. The results of the radioactive isotope dating of 210Pb adopt the previous research achievements of the team
.
4. Results
4.1. Grain Size Composition and Parameters of Sediments
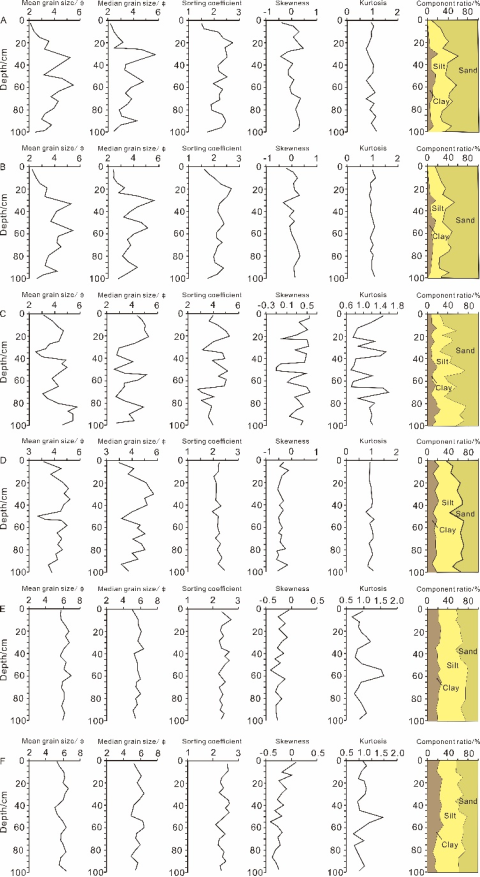
The grain size composition of the sediment core at sample point A is dominated by sand, followed by silt, and finally clay. In terms of lithological composition, the sediment type is relatively uniform, being silty sand. The average sand content is 68.43%; the average silt content is 25.24%, and the average clay content is 6.33% (
Figure 2). Analysis of the grain size parameters of the sediment core indicates that the median grain size and mean grain size exhibit similar trends, with the mean grain size ranging primarily between 2.65 to 5.35φ, and the median grain size ranging primarily between 2.35 to 5.76φ, corresponding overall to a relatively turbulent depositional environment (
Figure 2). The average sorting coefficient is 2.33, indicating sorting ranging from poor to very poor, which improves as the grain size decreases. The skewness varies dynamically from negatively skewed to positively skewed, and the kurtosis ranges from 0.75 to 1.12, representing a relatively stable, moderately peaked, and jagged pattern (
Figure 2). The silt content variation curve positively correlates with the mean grain size (median grain size) variation curve and exhibits certain fluctuations, varying from bottom to top.
Similarly, the grain size composition of the sediment core at sample point B is dominated by sand, followed by silt, and clay is the least abundant. In terms of lithological composition, the sediment type is also relatively uniform, being silty sand. The average sand content is 69.73%, the average silt content is 23.34%, and the average clay content is 6.93% (
Figure 2). Analysis of the grain size parameters of the sediment core reveals that the median grain size and mean grain size have similar trends, with the mean grain size ranging primarily between 2.72 to 5.46φ, and the median grain size ranging primarily between 2.21 to 5.87φ (
Figure 2). The average sorting coefficient is 2.25, indicating sorting ranging from poor to very poor, which improves as the grain size decreases (
Figure 2). The skewness varies dynamically from negatively skewed to positively skewed, and the kurtosis ranges from 0.86 to 1.08, representing a stable, moderately peaked, and non-sharp pattern (
Figure 2). The silt content variation curve positively correlates with the mean grain size (median grain size) variation curve and exhibits certain fluctuations, varying from bottom to top.
Figure 2. Vertical distribution of particle size parameters and sedimentary column components.
The grain size composition of the sediment core at sample point C is generally dominated by sand, followed by silt, and clay is the least abundant (
Figure 2). However, at depths of 50cm and 82-100cm, the proportion of silt is greater than that of sand. Lithologically, the sediment is primarily sand, and the sediment type is relatively uniform, being silty sand (
Figure 2). The mean grain size and median grain size vary vertically in a zigzag pattern, showing similar trends. The mean grain size ranges primarily between 2.52 to 5.81φ, and the median grain size ranges primarily between 2.35 to 5.21φ (
Figure 2). The sorting coefficient varies significantly, indicating poor sorting. The skewness varies significantly with an average value of 0.36, primarily positively skewed (
Figure 2). There are sudden increases in kurtosis values vertically, with an average kurtosis of 1.12. The mean grain size (median grain size) positively correlates with the proportion of silt, while skewness and kurtosis negatively correlate with the vertical changes in the proportion of silt (
Figure 2).
The grain size composition of the sediment core at sample point D is characterized by a higher proportion of silt in the lower part, followed by sand, and clay is the least abundant. In the upper part, the proportion of sand is the highest, followed by silt, and clay is the least abundant, with an average clay content of 10.14%, silt content of 55.25%, and sand content of 34.61% (
Figure 2). Lithologically, the sediment is sandy silt. The mean grain size ranges primarily between 3.42 to 5.11φ, indicating finer particles. The median grain size ranges primarily between 3.50 to 5.75φ, with sorting ranging from poor to very poor (
Figure 2). The skewness ranges from -0.65 to -0.76, all negatively skewed (
Figure 2). The kurtosis is moderately peaked, with little vertical variation in depth. Overall, the particle size tends to be stable, with silt being the dominant component. Notably, a coarse particle peak appears suddenly at a depth of approximately 45cm, making sand the dominant component (
Figure 2). The content of each component varies significantly at different depths, and the silt content variation curve positively correlates with the mean grain size variation curve (
Figure 2).
In the sediment column of sample point E, from a depth of 0 to 40cm, the grain size composition is sand > silt > clay, while from 40 to 100cm, it is silt > sand > clay (
Figure 2). Regarding lithological composition, the upper part is silty sand, and the lower part is sandy silt, with relatively small vertical variations in each component. The mean of the average grain size ranges from 5.24 to 6.75φ, and the median grain size is between 5.0 to 6.08φ (
Figure 2). The sorting is poor, with skewness values ranging from -0.49 to -0.12 (
Figure 2). The kurtosis ranges from 0.65 to 1.63, with significant vertical fluctuations (
Figure 2). The waveform variations of the average grain size (median grain size) are relatively consistent with silt's vertical weight fluctuation pattern (
Figure 2).
For the sediment column of sample point F, from a depth of 0 to 45cm, the grain size composition is sand > silt > clay, while from 45 to 100cm, it is silt > sand > clay (
Figure 2). From a lithological perspective, the upper part is silty sand, and the lower part is sandy silt, with small vertical variations in components. The mean of the average grain size primarily ranges from 5.11 to 6.46φ, and the median grain size is between 4.22 to 6.15φ (
Figure 2). The sorting is poor, with skewness values ranging from -0.49 to 0.15. The kurtosis ranges from 0.64 to 1.62, exhibiting significant vertical fluctuations (
Figure 2). The waveform variations of the average grain size (median grain size) align well with silt's vertical weight fluctuation pattern.
Overall, these features correspond to a relatively turbulent sedimentary environment. The average sorting coefficient is 2.33, indicating sorting from poor to very poor, which improves as the grain size decreases. The skewness varies dynamically from negatively skewed to positively skewed, and the kurtosis ranges from 0.75 to 1.12, showing a relatively stable sawtooth-like medium kurtosis (
Figure 2).
4.2. Grain Size Frequency Distribution of Sediments
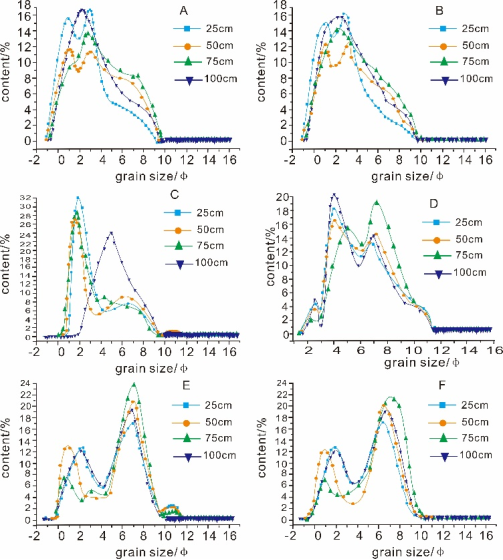
The grain size frequency curve at a depth of 25cm in sediment column A shows that particle sizes at 0.9φ and 3.0φ are relatively abundant, with a range of -1 to 10φ, indicating coarser particles (
Figure 3). Overall, it presents a continuous curve with a bimodal distribution. The grain size frequency curve at 50cm depth reveals that particle sizes at 0.8φ to 3.0φ are abundant, with contents above 8% within the range of 0 to 6φ, peaking at around 11% (
Figure 3). This indicates medium to coarse particles, and the overall curve also exhibits a bimodal distribution. At 75cm depth, the frequency curve shows a higher abundance of particles around 2.8φ, concentrated mainly within 0 to 7.8φ, suggesting medium to coarse particles, and the curve displays a unimodal distribution (
Figure 3). The curve at 100cm depth indicates a higher abundance of particles around 2.0φ, with a range of -1 to 10φ, suggesting coarser particles and a unimodal distribution (
Figure 3). In summary, the grain size frequency curves at 25cm, 50cm, 75cm, and 100cm depths in sediment column A suggest similar sedimentary dynamic intensities at the top and bottom (
Figure 3). At 75cm and 100cm, the particle sizes are mainly in the medium to coarse range of sand, indicating a relatively uniform dynamic environment (
Figure 3). The other two depths exhibit bimodal patterns, suggesting a combined effect of multiple sedimentary dynamics during deposition. Considering the overall grain size concentrated in the sandy to silty range of 0 to 8φ, it is inferred that the sedimentary site is primarily influenced by strong dynamics such as tidal currents and waves (
Figure 3)
| [1] | Luo, S. Y., Quan, X. W., Chen, B. S., et al. Grain Size Characteristics and Sedimentary Dynamics of Sedimentary Colu-mn of Mangrove Wetland in Zhanjiang Bay, Geoscience. 2021, 35(03): 647-656. https://doi.org/10.19657/j.geoscience.1000-8527.2020.101 |
| [2] | Chen, B. S., Chen, S. M., He, Z. P. Grain Size Distribution Features of Surface Sediments from Mangrove Wetland of Leizhou Peninsula, Geoscience. 2019, 33(01): 198-205. https://doi.org/10.19657/j.geoscience.1000-8527.2019.01.19 |
[1, 2]
.
Similarly, the grain size frequency curve at 25cm depth in sediment column B indicates that particle sizes at 1.0φ and 2.9φ are abundant, with a range of -1 to 10φ, and coarser particles (
Figure 3). The overall curve is continuous with a bimodal distribution. At 50cm depth, the curve shows that particle sizes at 1.0φ and 3.2φ are abundant, with contents above 8% within 0 to 5.8φ, peaking at around 12%, indicating medium to coarse particles and a bimodal distribution, though with a lower peak content compared to 25cm depth (
Figure 3). The curve at 75cm depth indicates a higher abundance of particles around 2.4φ, concentrated mainly within 0 to 6.3φ, suggesting medium to coarse particles and a unimodal distribution (
Figure 3). At 100cm depth, the curve shows a higher abundance of particles around 2.5φ, with a range of -1 to 10φ, indicating coarser particles and a unimodal distribution (
Figure 3). In general, the grain size frequency curves at 25cm, 50cm, 75cm, and 100cm depths in sediment column B also suggest similar sedimentary dynamic intensities at the top and bottom (
Figure 3). At 75cm and 100cm, the particle sizes are primarily in the medium to coarse range of sand, indicating a relatively uniform dynamic environment (
Figure 3)
| [1] | Luo, S. Y., Quan, X. W., Chen, B. S., et al. Grain Size Characteristics and Sedimentary Dynamics of Sedimentary Colu-mn of Mangrove Wetland in Zhanjiang Bay, Geoscience. 2021, 35(03): 647-656. https://doi.org/10.19657/j.geoscience.1000-8527.2020.101 |
| [2] | Chen, B. S., Chen, S. M., He, Z. P. Grain Size Distribution Features of Surface Sediments from Mangrove Wetland of Leizhou Peninsula, Geoscience. 2019, 33(01): 198-205. https://doi.org/10.19657/j.geoscience.1000-8527.2019.01.19 |
[1, 2]
. The other two depths exhibit bimodal patterns, suggesting a combined effect of multiple sedimentary dynamics. Considering the overall grain size concentrated in the sandy to silty range of 0 to 8φ, it is inferred that the sedimentary site in sediment column B is also primarily influenced by strong dynamics such as tidal currents and waves (
Figure 3)
| [1] | Luo, S. Y., Quan, X. W., Chen, B. S., et al. Grain Size Characteristics and Sedimentary Dynamics of Sedimentary Colu-mn of Mangrove Wetland in Zhanjiang Bay, Geoscience. 2021, 35(03): 647-656. https://doi.org/10.19657/j.geoscience.1000-8527.2020.101 |
| [2] | Chen, B. S., Chen, S. M., He, Z. P. Grain Size Distribution Features of Surface Sediments from Mangrove Wetland of Leizhou Peninsula, Geoscience. 2019, 33(01): 198-205. https://doi.org/10.19657/j.geoscience.1000-8527.2019.01.19 |
[1, 2]
.
The grain size frequency curve at 25cm depth in sediment column C indicates the highest abundance of particles at 2.0φ, accounting for approximately 32%, with a significant presence between 1 and 3.8φ (
Figure 3). The curve displays a continuous bimodal distribution, with a lower right peak and coarser particles. At 50cm depth, the curve shows high abundances of particles in the ranges of 0.8 to 2.5φ and 5.5 to 7.5φ, peaking at around 1.8φ with approximately 27% (
Figure 3). It exhibits a bimodal distribution with a lower right peak reaching a maximum of around 8%, overall characterized by coarse particles. The curve at 75cm depth indicates the highest abundance of particles at 1.8φ, accounting for about 29%, with a main distribution range of 0.8 to 5.0φ, showing a unimodal distribution (
Figure 3). The curve at 100cm depth shows that particle sizes between 2.8 and 8.2φ all exceed 8% in abundance, peaking at 5.0φ with around 24%, overall displaying a unimodal distribution with medium-sized particles at the peak (
Figure 3). The dominant peaks at 25cm, 50cm, and 75cm depths in the frequency curves of sediment column C are concentrated on the coarse particle end, indicating strong sedimentary medium dynamics. The secondary peaks on the right side are within the range of 4.0 to 8.0φ, belonging to the transition range from very fine sand to coarse and fine silt (
Figure 3). The frequency curve at 100cm exhibits a unimodal pattern, dominated by fine sandy silt, reflecting a single low-energy sedimentary environment. In general, the frequency curves of various sampling points indicate changes in the sedimentary environment at different stages, influenced by a variety of sedimentary media
| [1] | Luo, S. Y., Quan, X. W., Chen, B. S., et al. Grain Size Characteristics and Sedimentary Dynamics of Sedimentary Colu-mn of Mangrove Wetland in Zhanjiang Bay, Geoscience. 2021, 35(03): 647-656. https://doi.org/10.19657/j.geoscience.1000-8527.2020.101 |
| [2] | Chen, B. S., Chen, S. M., He, Z. P. Grain Size Distribution Features of Surface Sediments from Mangrove Wetland of Leizhou Peninsula, Geoscience. 2019, 33(01): 198-205. https://doi.org/10.19657/j.geoscience.1000-8527.2019.01.19 |
[1, 2]
.
The grain size frequency curve at 25cm depth in sediment column D reveals the highest abundances of particles at 4.0φ and 7.0φ, peaking at around 20%, with a particle size range of 1.5 to 11.3φ (
Figure 3). Overall, it displays a continuous bimodal distribution, characterized by medium and fine particles. The curve at 50cm depth indicates higher abundances of particles between 3.2 and 8.5φ, peaking at 4.1φ and 7.5φ, consistent with the 25cm curve in terms of its bimodal distribution and a tendency towards medium and fine particles (
Figure 3). The curve at 75cm depth shows the highest abundance of particles at 7.5φ, followed by around 5.2φ, with a main distribution between 4 and 9φ, suggesting finer particles (
Figure 3). Overall, the curve trend is similar to that of the 25cm and 50cm curves, displaying a bimodal distribution but with the highest content in the right peak (
Figure 3). The curve at 100cm depth indicates the highest abundance of particles around 4.1φ, reaching 20%, followed by higher abundances around 7φ, forming a continuous bimodal curve with medium and fine particle characteristics (
Figure 3). The frequency distribution curves at various depths in sediment column D exhibit similar patterns, with all four curves showing primary and secondary bimodal patterns, and sediment grain sizes concentrated in the silt range. The highest peak in the frequency curve at 100cm is within the coarse silt range, indicating strong dynamic action (
Figure 3). The main peak of the curve at 75cm is located at the fine end, with fine silt grain sizes prominent, suggesting weaker dynamic action (
Figure 3). The curves at 25cm and 50cm are similar in shape, likely representing two identical sedimentary dynamics but differing in strength (
Figure 3). Based on this, it is inferred that the area is primarily influenced by weak tidal and wave dynamics, resulting in fine-grained sediments.
The grain size frequency curve at 25cm depth in sediment column E shows the highest abundance of particles at 7.0φ, accounting for around 16%, followed by 2.0φ with approximately 13% (
Figure 3). It displays a continuous bimodal curve with a higher right peak, characterized by medium and fine particles. At 50cm depth, the curve indicates the highest abundance of particles at 7.0φ, reaching 20%, followed by 1.0φ at around 13%, also showing a bimodal distribution with an extreme range of particle sizes (
Figure 3). The curve at 75cm depth indicates the highest abundance of particles at 7.0φ, accounting for approximately 24%, and overall exhibits a multi-modal distribution with two lower peaks on the left, displaying a mixture of fine particles with a few coarse particles (
Figure 3). The curve at 100cm depth also shows the highest abundance of particles at 7.0φ, with contents exceeding 8% between 1.0 and 3.0φ and 5.0 and 8.2φ (
Figure 3). It matches the fluctuations of the 25cm curve, displaying a bimodal distribution and medium-to-fine particle characteristics. The frequency curves at the bottom and top of the sediment column are highly consistent, with fine silt dominant and secondary peaks belonging to coarse to medium-fine sand. The main peaks at 50cm and 75cm are concentrated between 6.0φ and 8.5φ, while the secondary peaks are between 0 and 2.0φ, representing the transition range from very coarse sand to coarse and medium sand (
Figure 3). Additionally, all curves at 25cm, 50cm, and 75cm have a small low peak at the tail, representing very fine particles. The overall particle characteristics combined with regional hydrological features suggest that the sedimentary hydrodynamic forces in this area are weak, possibly due to weak waves and tides, mixed with coarse and very fine particles, indicating potential human disturbance.
Sediment column F exhibits similar sedimentary characteristics to sediment column E. The grain size frequency curve at 25cm depth shows the highest abundance of particles at 6.2φ, accounting for around 17%, followed by 2.0φ at approximately 13% (
Figure 3). It displays a continuous bimodal curve with a higher right peak, characterized by medium and fine particles. At 50cm depth, the curve indicates the highest abundance of particles at 6.5φ, reaching 20%, followed by 1.0φ at around 12%, also showing a bimodal distribution with an extreme range of particle sizes (
Figure 3). The curve at 75cm depth indicates the highest abundance of particles at 7.5φ, accounting for approximately 21%, and overall exhibits a multi-modal distribution with a lower left peak, displaying a mixture of fine particles with a few coarse particles (
Figure 3). The curve at 100cm depth also shows the highest abundance of particles at 7.0φ, matching the fluctuations of the 25cm curve, displaying a bimodal distribution and medium to fine particle characteristics (
Figure 3). The frequency curves at the bottom and top of the sediment column are highly consistent, with fine silt dominant and secondary peaks belonging to coarse to medium-fine sand. The main peaks at 50cm and 75cm are concentrated between 5.0 and 8.5φ, while the secondary peaks are between 0 and 2.0φ, representing the transition range from very coarse sand to coarse and medium sand (
Figure 3). The overall particle characteristics combined with regional hydrological features suggest that the sedimentary hydrodynamic forces in this area are weak, possibly due to weak waves and tides, mixed with coarse particles, indicating potential human disturbance.
Figure 3. Grain size distribution frequency curves of sedimentary columns in the Zhanjiang Bay.
5. Discussion
Specific sedimentary environments possess distinct characteristics of sediment grain size parameters. Utilizing these parameters can not only invert the accumulation process and sedimentary hydrodynamic characteristics of sediments but also indicate the transport direction and intensity of sediments
| [9] | Allen, P. A., Michael, N. A., D’Arcy, M., et al. Fractionation of grain size in terrestrial sediment routing systems, Basin Res. 2017, 29: 180-202. https://doi.org/10.1111/bre.12172 |
| [10] | Xu, Y., Wang, T. F. Characteristics of sediment particle size and their response to storm surge in the Zhanjiang Mangrove Nature Reserve, Journal of Applied Oceanography. 2011, 30(02): 269-274. |
[9, 10]
. Generally, stronger transport forces result in coarser sediment particles, while fine-grained sedimentary materials indicate weaker transport forces. The mean grain size reflects the average kinetic energy of the sedimentary medium and is closely related to the material from the source area
. The sorting coefficient is also influenced by the interaction between source materials and sedimentary media. When new materials are introduced, sorting becomes poorer, and the sorting curve becomes asymmetric, showing positive or negative skewness
| [9] | Allen, P. A., Michael, N. A., D’Arcy, M., et al. Fractionation of grain size in terrestrial sediment routing systems, Basin Res. 2017, 29: 180-202. https://doi.org/10.1111/bre.12172 |
| [12] | Zhao, S. H., Xu, J., Fang, X. D, et al. Research on grain-size characteristics and deposition rate of sediment cores in northern Fujian offshore area, Journal of Applied Oceanography. 2012, 31(02): 277-285. |
[9, 12]
.
The mean grain sizes of sediment columns A to F in the study area mainly range from 2.65 to 5.35φ, 2.72 to 5.46φ, 2.52 to 5.81φ, 3.42 to 5.11φ, 5.24 to 6.75φ, and 5.11 to 6.46φ, respectively, with average sorting coefficients of 2.25, 2.36, 4.52, 2.24, 2.35, and 2.41, indicating overall poor sorting. Since each sampling point is located at the tidal flats of different coastal zones or islands, the grain size distribution characteristics of sediments are deeply influenced by terrestrial or island materials in the region. Moreover, due to different sedimentary environments and hydrodynamics, significant differences in mean grain size and sorting are observed. The skewness of sediment columns A to F varies considerably (
Figure 2), ranging from negative to positive skewness. As the sorting coefficient increases at some depths, the skewness transitions from negative to nearly symmetric and then to positive, with the kurtosis gradually broadening, indicating the involvement of multiple processes in the deposition. The kurtosis follows a normal distribution with dynamic changes at different depths, suggesting that the sediments in Zhanjiang Bay are mainly terrestrial materials with possibly a small portion from other sources, such as human activities and ocean waves. The frequency curve characteristics show that the frequency distribution curves at different depths of each sediment column exhibit bimodal or unimodal patterns, and vertically present layered variations with changes in grain size composition (
Figure 3), indicating that sediment deposition in Zhanjiang Bay during different periods was influenced by two or more sedimentary media, resulting in a complex sedimentary environment
| [1] | Luo, S. Y., Quan, X. W., Chen, B. S., et al. Grain Size Characteristics and Sedimentary Dynamics of Sedimentary Colu-mn of Mangrove Wetland in Zhanjiang Bay, Geoscience. 2021, 35(03): 647-656. https://doi.org/10.19657/j.geoscience.1000-8527.2020.101 |
| [2] | Chen, B. S., Chen, S. M., He, Z. P. Grain Size Distribution Features of Surface Sediments from Mangrove Wetland of Leizhou Peninsula, Geoscience. 2019, 33(01): 198-205. https://doi.org/10.19657/j.geoscience.1000-8527.2019.01.19 |
[1, 2]
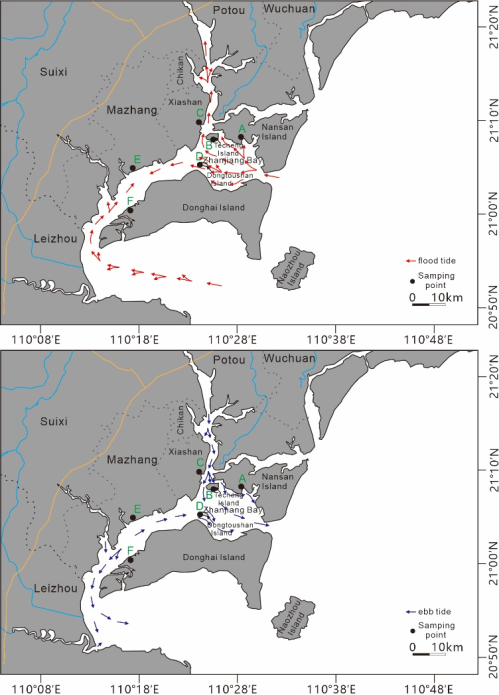
. Overall, the sedimentary characteristic parameters and frequency curve features, combined with the geographical location of the study area, indicate that tidal dynamics profoundly affect sediment deposition in Zhanjiang Bay. Dominated by tidal dynamics, Zhanjiang Bay features primarily tidal troughs. Tidal water enters the bay through the tidal channel between Nansan Island and Donghai Island, and splits into two branches upon reaching Dongtoushan Island along the southern trough. One branch flow towards the peninsula through the channel south of Dongtoushan Island, while the other branch heads north and splits into two parts, one flowing west towards the peninsula and the other moving north upstream along the Zhanjiang Waterway (
Figure 4)
| [7] | Huang, R. Q. Observational study on spatial-seasonal variation oftemperature, salinity and currents in the Zhanjiang, G-uangdong Ocean University. 2021. https://doi.org/10.27788/d.cnki.ggdhy.2021.000024 |
| [13] | Li, G. J., Hu, J. P. Numerical simulation of tidal current fields near Donghai Island of Zhanjiang Bay, Journal of Waterway and Harbor. 2007, (05): 325-330. |
[7, 13]
. As the upstream part narrows, energy converges, water depth increases and flow velocity accelerates. In contrast, the western part features a vast bay area with shallow water and weaker flow velocities (
Figure 4).
Combining the dating results, parameter characteristics, frequency curves, and regional economic and social backgrounds of each sediment column, the sedimentary hydrodynamic evolution processes of each sediment column were obtained. Column A is dominated by sandy components vertically, indicating strong hydrodynamics and an overall stable sedimentary environment in this sea area over the past century, which can be divided into three stages: The first stage (100-70 cm, 1898-1943) featured strong hydrodynamics, with sandy particles as the main sedimentary component and a relatively stable sedimentary environment, possibly related to the strong dynamics of tidal troughs
| [1] | Luo, S. Y., Quan, X. W., Chen, B. S., et al. Grain Size Characteristics and Sedimentary Dynamics of Sedimentary Colu-mn of Mangrove Wetland in Zhanjiang Bay, Geoscience. 2021, 35(03): 647-656. https://doi.org/10.19657/j.geoscience.1000-8527.2020.101 |
| [2] | Chen, B. S., Chen, S. M., He, Z. P. Grain Size Distribution Features of Surface Sediments from Mangrove Wetland of Leizhou Peninsula, Geoscience. 2019, 33(01): 198-205. https://doi.org/10.19657/j.geoscience.1000-8527.2019.01.19 |
[1, 2]
. The second stage (70-25 cm, 1932-1993) saw an increase in silt components but also an increase in clay content, with a significant acceleration in sedimentation rate, possibly related to human activities disturbing the sedimentary layers. Construction projects such as seawalls and land reclamation interfered with the hydrodynamic environment of nearby sea areas, thereby affecting the sedimentary sequence
| [1] | Luo, S. Y., Quan, X. W., Chen, B. S., et al. Grain Size Characteristics and Sedimentary Dynamics of Sedimentary Colu-mn of Mangrove Wetland in Zhanjiang Bay, Geoscience. 2021, 35(03): 647-656. https://doi.org/10.19657/j.geoscience.1000-8527.2020.101 |
| [2] | Chen, B. S., Chen, S. M., He, Z. P. Grain Size Distribution Features of Surface Sediments from Mangrove Wetland of Leizhou Peninsula, Geoscience. 2019, 33(01): 198-205. https://doi.org/10.19657/j.geoscience.1000-8527.2019.01.19 |
[1, 2]
. The third stage (25 cm to the surface, 1993-2016) featured coarser sediment particles dominated by sand, with wave erosion as the primary process
| [1] | Luo, S. Y., Quan, X. W., Chen, B. S., et al. Grain Size Characteristics and Sedimentary Dynamics of Sedimentary Colu-mn of Mangrove Wetland in Zhanjiang Bay, Geoscience. 2021, 35(03): 647-656. https://doi.org/10.19657/j.geoscience.1000-8527.2020.101 |
| [2] | Chen, B. S., Chen, S. M., He, Z. P. Grain Size Distribution Features of Surface Sediments from Mangrove Wetland of Leizhou Peninsula, Geoscience. 2019, 33(01): 198-205. https://doi.org/10.19657/j.geoscience.1000-8527.2019.01.19 |
[1, 2]
. Column B is similar to Column A, except that its bottom has a higher sand content, indicating stronger hydrodynamics. Considering its location in the center of the waterway, it is primarily influenced by the strong dynamics of tidal troughs, followed by wave action. The high sand content at the top may be related to the construction and expansion of Zhanjiang Port
| [14] | Chen, T. Q. In-depth implementation of port economic development strategy to accelerate the Zhanjiang modernization process, History and Literature Studies on CPC. 1996, (S1): 4-7. |
[14]
.
Column C is located upstream of the tidal channel, where strong hydrodynamic forces in the deep trough prevent fine particles from depositing, resulting in coarser particles overall in the sedimentary layers. Additionally, the upstream Zhanjiang Waterway carries abundant sediments downstream along the channel, providing sufficient sediment supply. Coarser particles deposit first during transport, while finer particles are transported further downstream by runoff and deposited within Zhanjiang Bay. Column C is located in the midstream (
Figure 1), and still has sediments with larger particle sizes (
Figure 2). The sedimentary characteristics combined with the geographical location indicate that medium to coarse sand accumulates in the intertidal zone due to wave transport and tidal action, resulting in poor sorting
| [1] | Luo, S. Y., Quan, X. W., Chen, B. S., et al. Grain Size Characteristics and Sedimentary Dynamics of Sedimentary Colu-mn of Mangrove Wetland in Zhanjiang Bay, Geoscience. 2021, 35(03): 647-656. https://doi.org/10.19657/j.geoscience.1000-8527.2020.101 |
| [2] | Chen, B. S., Chen, S. M., He, Z. P. Grain Size Distribution Features of Surface Sediments from Mangrove Wetland of Leizhou Peninsula, Geoscience. 2019, 33(01): 198-205. https://doi.org/10.19657/j.geoscience.1000-8527.2019.01.19 |
[1, 2]
.
Column D is dominated by silt particles vertically, with an increased clay content compared to the first two sedimentary columns, indicating weaker sedimentary dynamic environments over a century-long scale. Vertically, it can be roughly divided into four stages: The first stage (100-90 cm, 1840-1868) saw a significant increase in sand, possibly related to strong tidal scouring in this branch tidal channel. The second stage (90-55 cm, 1868-1950) was dominated by silt, with weakened tidal scouring and weak tidal currents leading to increasingly significant siltation. The third stage (50-40 cm, 1965-1983) featured an increase in mean particle size and strong hydrodynamic conditions, possibly related to typhoon disasters during this period. From 1954 to 1976, Zhanjiang suffered 133 typhoons, and storm sediment fluxes were at least 2.7 times those of tidal sediment fluxes
| [1] | Luo, S. Y., Quan, X. W., Chen, B. S., et al. Grain Size Characteristics and Sedimentary Dynamics of Sedimentary Colu-mn of Mangrove Wetland in Zhanjiang Bay, Geoscience. 2021, 35(03): 647-656. https://doi.org/10.19657/j.geoscience.1000-8527.2020.101 |
| [3] | Li, T., Li, T. J., Chen, L., et al. The grain-size characteristics and their environmental indications of the island intertidal surface sediments of Zhanjiang offshore area, Marine Sciences. 2012, 36(04): 113-120. |
[1, 3]
. Storm surges triggered by typhoons can lead to coarser mangrove sediment grain sizes and accelerated sedimentation rates
| [10] | Xu, Y., Wang, T. F. Characteristics of sediment particle size and their response to storm surge in the Zhanjiang Mangrove Nature Reserve, Journal of Applied Oceanography. 2011, 30(02): 269-274. |
| [15] | Lu, W. F. Discussion on the present situation of geological hazards in Zhanjiang, Guangdong Province, West-China Exploration Engineering. 2007, (02): 97-100. |
| [16] | Tang, X. C., Liu, H. P., Pan, A. D., et al. Analysis of Disastrous Features of Landing Typhoo in Coastal Regions of Guangdong Province in Recent 50 Years, Scientia Geographica Sinica. 2003, (02): 182-187. |
[10, 15, 16]
. The fourth stage (40 to the surface cm, 1983-2016) was dominated by silt, suggesting that weak tidal currents were the primary influence during this period, depositing finer particles. There was an increasing trend in sand content and an accelerated sedimentation rate, possibly related to recent channel dredging and enhanced hydrodynamics
| [1] | Luo, S. Y., Quan, X. W., Chen, B. S., et al. Grain Size Characteristics and Sedimentary Dynamics of Sedimentary Colu-mn of Mangrove Wetland in Zhanjiang Bay, Geoscience. 2021, 35(03): 647-656. https://doi.org/10.19657/j.geoscience.1000-8527.2020.101 |
| [2] | Chen, B. S., Chen, S. M., He, Z. P. Grain Size Distribution Features of Surface Sediments from Mangrove Wetland of Leizhou Peninsula, Geoscience. 2019, 33(01): 198-205. https://doi.org/10.19657/j.geoscience.1000-8527.2019.01.19 |
| [7] | Huang, R. Q. Observational study on spatial-seasonal variation oftemperature, salinity and currents in the Zhanjiang, G-uangdong Ocean University. 2021. https://doi.org/10.27788/d.cnki.ggdhy.2021.000024 |
[1, 2, 7]
.
The tidal effects at locations E and F are much weaker. After passing through a narrow channel, the southern current enters an open channel where water is released and the flow velocity decreases. Under weak hydrodynamic conditions, finer particles are deposited (
Figure 4). Therefore, these two sedimentary columns are generally dominated by silt with slightly negative skewness, and the proportion of clay is also high. Due to the blocking effect of the Donghai Dike (built-in 1958) and the reduction in sea area caused by coastal aquaculture in the southwestern waterway of Donghai Island
| [4] | Zhang, J. B., Yao, J. H., Chen, C. L., et al. Grain size distribution of surface sediments and its correlation with environmental factors in intertidal flat of Donghai Island, Zhanjiang, Journal of Applied Oceanography. 2015, 34(01): 49-56. |
[4]
, a weak current flows northward and converges with the current flowing from east to west through the tidal inlet in the Tongming sea area, forming a tidal convergence point
. The hydrodynamic force here blends, weakens, or even cancels out, which is more conducive to the deposition of fine particles. Part of the tide entering the tidal inlet stretches towards the bay along the deep trough in the south of Nansan Island, which is also unfavorable for the deposition of fine particles in the southern sea area of Nansan Island
. The Zhanjiang Bay has good shelter conditions and low wind and waves. The sampling points of sedimentary columns A and B are located in north of the Zhanjiang Bay, facing the tidal channel of the Zhanjiang Bay. Therefore, the fine particles in the sediments in this sea area are transported away due to their lightweight under strong hydrodynamic effects. In general, the sediments are dominated by coarser sandy components, and fine dust particles may originate from wind transport, upstream runoff sediments, offshore sediments, and land-derived sediments
| [2] | Chen, B. S., Chen, S. M., He, Z. P. Grain Size Distribution Features of Surface Sediments from Mangrove Wetland of Leizhou Peninsula, Geoscience. 2019, 33(01): 198-205. https://doi.org/10.19657/j.geoscience.1000-8527.2019.01.19 |
| [17] | Zhao, C. J. Hydrographic and sediment analysis of Zhanjiang Bay, Journal of Waterway and Harbor. 1999, (04): 16-21. |
[2, 17]
.
It is noteworthy that sedimentary columns A, B, C, and D all show an increase in deposition rate and a predominance of sand after 2000. The deposition rate of D exceeds that of A after 2011 and reaches 2.97 cm/a in 2015
| [1] | Luo, S. Y., Quan, X. W., Chen, B. S., et al. Grain Size Characteristics and Sedimentary Dynamics of Sedimentary Colu-mn of Mangrove Wetland in Zhanjiang Bay, Geoscience. 2021, 35(03): 647-656. https://doi.org/10.19657/j.geoscience.1000-8527.2020.101 |
| [2] | Chen, B. S., Chen, S. M., He, Z. P. Grain Size Distribution Features of Surface Sediments from Mangrove Wetland of Leizhou Peninsula, Geoscience. 2019, 33(01): 198-205. https://doi.org/10.19657/j.geoscience.1000-8527.2019.01.19 |
| [7] | Huang, R. Q. Observational study on spatial-seasonal variation oftemperature, salinity and currents in the Zhanjiang, G-uangdong Ocean University. 2021. https://doi.org/10.27788/d.cnki.ggdhy.2021.000024 |
[1, 2, 7]
, which may be mainly controlled by recent human activities that have profoundly altered the beach environment. Due to changes in tidal flat utilization status, such as reclamation for farmland and salt evaporation ponds, the construction of docks, and the expansion of coastal cities
| [18] | Deng, P. Y., Liu, W. Comprehensive Value Assessment of Zhanjiang Mangrove Wetland. Ecological Economy, 2007, (06): 126-128+133. |
[18]
, large-scale human activities have put tremendous pressure on the mangroves and their habitats in Zhanjiang, damaging the roots and seedlings of mangroves and directly leading to their death. The destruction of mangroves and the opening of shorelines have reduced their ability to capture fine particles. Meanwhile, the incident wave energy increases, which can transport coarse particles from the bare beach in front of the forest, accelerating the deposition of coarse particles. The backflow carries away fine materials, resulting in a coarsening trend in the sedimentary layers and an increasing proportion of sand. In addition, in recent years, projects such as Baosteel Steel Plant and Donghai Island Railway have been established on Donghai Island, and the mid-term construction of the reclamation project in Zhanjiang Bay completed in 2015 reduced the bay area by 3.4% compared to 2003
. The construction of these projects disturbed the original sedimentary layers, causing redeposition and accelerating the sedimentation in the surrounding sedimentary sea areas. As the deposition rate in Zhanjiang Bay increases, the shoals are significantly silted up, and the sea is gradually shallowing. Consequently, the tidal prism of Zhanjiang Bay decreases, which may affect the use of navigation channels. Therefore, it is necessary to take relevant measures to strengthen the protection of mangroves, control human activities, and maintain the ecological health and sustainable development of Zhanjiang Bay.
6. Conclusions
Based on the analysis of grain size characteristics of sediment columns in Zhanjiang Bay and their indicative significance for sedimentary dynamic environments, the following understandings are obtained:
(1) Sediment columns A and B exhibit poor sorting and relatively flat kurtosis, with sediment types classified as silty sand. Column C displays fluctuating average particle sizes and kurtosis curves, poor sorting, positively skewed skewness, and sediment type of silty sand. Column D is negatively skewed, poorly sorted, with moderate kurtosis, and classified as sandy silt. Columns E and F are also negatively skewed, poorly sorted, with significant kurtosis variations, and categorized as sandy silt.
(2) The grain size frequency distribution curves at depths of 25 cm, 50 cm, 75 cm, and 100 cm for each sediment column exhibit bimodal and unimodal patterns, indicating the involvement of multiple depositional media in the depositional process. The grain sizes of columns A, B, C, and D are concentrated towards sandy particles, indicating strong depositional dynamics. In contrast, columns E and F are dominated by silt grains, indicating weaker depositional dynamics.
(3) The sediment characteristics of Zhanjiang Bay are profoundly influenced by terrestrial or island-derived materials, upstream river sediments, tidal and wave dynamics, mangrove distributions, and human activities. These factors significantly impact the sedimentation within the bay and are closely related to the acceleration of deposition rates. The notable increase in deposition rates in recent years has widened the shoals in Zhanjiang Bay, potentially affecting the use of navigation channels. This issue requires attention, and efforts should be intensified to protect mangroves.